Abstract
In the near future, there will be a need for accommodating large populations of fast moving Unmanned Aerial Systems (UAS) operating in uncontrolled, very low level (VLL) (below 500 ft.) airspace. As is well-known, real-time knowledge of the wireless propagation channel is essential for the effective design and optimization of wireless communication systems. In this paper, we propose a software defined radio (SDR) based channel sounder employing a wideband linear frequency modulated continuous wave (FMCW) or chirp waveform technique for low altitude air-to-air (AA) links. This paper discusses both matched filter and heterodyne detector implementations in the receiver, and investigates advantages and disadvantages of both architectures for an SDR implementation in an AA scenario. We also discuss proper windowing techniques in the transmitter to improve sounding resolution. Some proof of concept measurement results using SDRs are presented for a simulated UAS scenario.
I. Introduction
In the near future, very low-level (VLL) aircraft will need to communicate via wideband air-to-air (AA), air-to-ground (AG) and even air-to-satellite (AS) links. These UAS must not interfere with any existing infrastructure or impede efficient air traffic management. Ensuring this requires extremely reliable communications, navigation, and surveillance. NASA�s UAS traffic management program [1] is coordinating research and development for VLL conditions, but has not addressed the lower layers of the communications protocol stack, specifically the physical (PHY) and data link layers (DLL), which include a number of key design choices, e.g., waveforms, channels, multiple access, etc. Quantifying radio propagation characteristics is critical for the efficient design of reliable wireless communication systems since the channel can have performance limiting effects.
Growth in the number of aeronautical wireless devices in the national airspace may require operation of some links as second order users. These users would access existing resources when not used by primary users. Many solutions have been proposed in the literature to alleviate spectrum congestion. As an example, for multicarrier schemes such as Orthogonal Frequency Division Multiple Access (OFDMA), the subcarriers can be allocated to users as needed. In order to properly configure such a scheme, one needs to know the channel characteristics, particularly delay spread and Doppler spread. OFDM has been applied for over a decade in terrestrial wireless systems, as it is often an excellent method for high rate bi -directional wireless data communication. It can also be a good candidate for wideband communications to transmit/receive payload data from one Unmanned Aerial System (UAS) to another.
Many studies have been done for estimating channel characteristics, in multiple environments. Such measurements are often termed �sounding.� With the growth in use of UAS, aeronautical propagation channels have also been studied in recent years. In many channel measurement campaigns, sophisticated channel sounders were used [2]-[6], but there is limited work on real time sounding in VLL scenarios, particularly with software defined radios (SDRs). Low altitude UAS usually have a limited �maximum payload/takeoff handling weight,� therefore using low-weight, low-cost and multi-purpose SDRs as channel sounders can be an attractive solution. Moreover, the flexibility and re-configurability of SDRs can enable easy adjustment of measurement parameters in a short time.
Channel sounding is done by exciting the channel with a known input signal. The aim is to estimate some characteristics of the channel. For narrowband channels, this is typically the attenuation, which may include fading. For wideband channels, one desires an estimate of the channel impulse response (CIR), or its Fourier transform, the channel transfer function (CTF). �Since most channels have time (and spatial) variation, they are often characterized statistically. For the CIR, one wants the amplitudes, delays, and time variation of all multipath components (MPCs). This enables computation of delay spread and Doppler spreads, which are important to determine the appropriate communication signaling design. Designing a communication system without accurate channel knowledge will yield sub-optimal performance. For example, if a signal�s bandwidth is larger than the channel�s coherence bandwidth, distortion results, and this must either be mitigated (increasing complexity), or a performance degradation (e.g., larger error probability) must be accepted.
The OFDM multicarrier signal is sensitive to frequency offset and drifts that can be caused by the Doppler effects in rapidly time-varying channels such as VLL AA communication links. Multipath components can also have a detrimental effect on OFDM system performance, where orthogonality of the subcarriers can be lost when the delay spread is significant. Therefore, OFDM systems employ guard intervals to avoid intersymbol interference. During the guard interval, the transmitter can send nothing, or most commonly, a cyclic prefix (CP) which is an exact copy of a segment of the last portion of the OFDM symbol. The length of the guard interval and subcarrier spacing are generally set in advance of transmission [7] [8].
The flexibility and re-configurability of SDRs enables cognitive sounding, which means enabling real time CP length and subcarrier spacing adjustment in order to achieve the best performance in different channel scenarios. Although small commercial SDRs may not be able to perform all sophisticated sounding techniques [9] due to their limitations in bandwidth however, their flexibility and re-configurability are suitable for cognitive sounding in dynamic AA channels.
II. Chirp Channel Sounding Principles
Unmodulated continuous-wave (CW) sounders transmit a single tone with constant frequency. The lack of modulation of the source only allows for determination of Doppler shift and amplitude at that specific frequency. In contrast, a frequency modulated continuous-wave (FMCW) signal, also known as a chirp, employs frequency modulation at the signal source to enable channel transfer function measurements. The FMCW sounder usually transmits a signal that has a linear frequency increase or decrease over a frequency range of B Hz in T seconds, where B/T Hz/s is known as the �sweep rate� and the �time bandwidth product� BT is the �dispersion factor� [9]. Mathematically a chirp signal is expressed as [10]:
|
|
(1) |

where ![]() �is the carrier frequency in radians/s and
�is the carrier frequency in radians/s and ![]() . As calculated in [9], [10], the
spectrum for large time bandwidth values is represented by,
. As calculated in [9], [10], the
spectrum for large time bandwidth values is represented by,
|
|
|

The chirp bandwidth (B) and waveform
repetition frequency (WRF) are the main parameters that should be considered in
designing chirp signals for sounders. The WRF value is proportional to the reciprocal
of the chirp duration, i.e., proportional to 1/T. The maximum Doppler
shift that the chirp sounder can detect depends on the repetition frequency as![]() . The channel delay
resolution increases as bandwidth increases.
. The channel delay
resolution increases as bandwidth increases.
Unlike pulsed-sounders, the spectrum of
chirp sounders is predominantly contained within the frequency range of the swept
bandwidth, therefore filtering is not necessary prior to transmission (although
some filtering is generally applied). Chirp sounder receivers must process the
received signal to extract channel characteristics, and there are typically two
options for receiver structures. In this paper, we employ both matched filter
and heterodyne detectors for our simulations and measurements.
A. Matched filter detector
The
technique of matched filtering is known to maximize sample time SNR; the
matched filter CIR is the (conjugate of the) time-reversed transmit signal
pulse. This filtering can also be expressed as a correlation. This correlation enables
estimation of the CIR parameters (i.e., MPC delays and amplitudes, and with
their time variation Doppler spread can also be estimated. A block diagram of a
matched filter detector for a chirp sounder is depicted in Figure 1, where the distorted
received signal is convolved with a conjugated time-reversed version of the transmitted
chirp signal.

Figure 1. Matched filter block chain.
The impulse response of the filter matched to the signal (1) is
given by
|
|
(3) |

where k is an arbitrary
real constant. By imposing a unity gain condition at ![]() �[10],
the matched-filter constant will be
�[10],
the matched-filter constant will be
|
|
(4) |

Equation (3) represents a chirp signal
with a frequency slope opposite to that of the transmitted signal. The output
of the matched filter is found by convolving the chirp signal with the matched
filter response, therefore the matched filter accomplishes time compression by
delaying the frequencies in their reverse order, thereby bringing all the
frequencies back in phase. The output of the matched filter for a chirp signal
with a 1 MHz bandwidth and one millisecond duration is depicted in Figure
2. The inset shows the result near the peak at 1 ms.

Figure 2. Compressed signal at matched filter output.
As depicted in Figure 2, the envelope
of the compressed signal is of the form of a sin(x)/x function; is the Fourier transform of
a rectangular pulse over the bandwidth of the chirp signal. The
success of the matched-filter detector technique in a multipath channel critically
depends on producing a compressed-pulse waveform at the output of the matched
filter with smaller side-lobes. The amplitude of time domain side-lobes of the compressed signal
determine the resolution of multipath components in the sounder. The first and
the largest side-lobe is only 13.5 dB
below the peak of the compressed pulse and the side-lobes after that decrease
by approximately 3 dB per side-lobe interval (Figure 3).
To minimize the effects of these unwanted side-lobes on the system
performance, different methods such as windowing have been proposed [10]. In
this paper, we weight the transmitted signal in either the time or frequency
domain by using various weighting functions. Thus although the theoretical time delay resolution of a chirp signal
is 1/B seconds, practically it also depends on the window function used
to reduce the side-lobes of the compressed signal. Proper windowing can
increase time delay resolution while it costs in signal-to-noise ratio (SNR). Therefore,
there is a tradeoff between resolution and main lobe signal amplitude in
designing the window function. Our windowing function is based on an
algorithm introduced in [11], and is called Taylor windowing. Although in [9], the Hamming window
was mentioned as having the best windowing performance for sounders with noise
floor nearly -60 dB relative to
desired signal, the main lobe degradation is significant (approximately � 11
dB). A comparison
these different windowing functions is depicted in Figure 3.
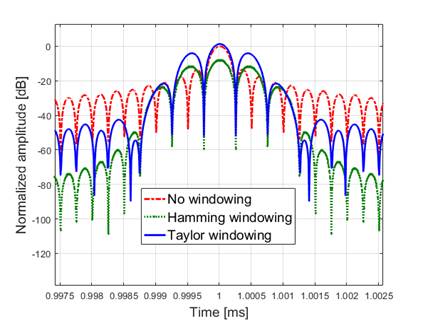 Figure 3. Comparison
between two well-known windowing functions.
Figure 3. Comparison
between two well-known windowing functions.
In Figure 3 the amplitude of the
Hamming main lobe is smaller than for the other two, but its side lobes are
lower. Taylor windowing on the other hand has a tradeoff between Hamming and no
windowing.
B. Heterodyne detector
The technique of heterodyne detection
is based on multiplication of the received signal by a delayed replica of the
transmitted signal ![]() . The frequency sweeps upward linearly, then the output of the
multiplication is low pass filtered. The spectrum of the receiver output is then
analyzed to achieve the sin(x)/x
compression. The block diagram is depicted in Figure 4.
. The frequency sweeps upward linearly, then the output of the
multiplication is low pass filtered. The spectrum of the receiver output is then
analyzed to achieve the sin(x)/x
compression. The block diagram is depicted in Figure 4.
 Figure 4. Heterodyne detector
block diagram.
Figure 4. Heterodyne detector
block diagram.
Assuming an ideal channel, the output of the heterodyne mixer can
be represented mathematically as
|
|
(5) |


After applying a low-pass filter the first term is removed,
therefore the frequency of the remaining term is given by
|
|
(6) |

where ![]() �is the time difference
between the original chirp signal and the locally generated signal. Thus, the
filter cutoff-frequency
�is the time difference
between the original chirp signal and the locally generated signal. Thus, the
filter cutoff-frequency ![]() �should be chosen in a way
to accommodate the time delay
�should be chosen in a way
to accommodate the time delay ![]() �of the longest-delay MPC
with frequency of
�of the longest-delay MPC
with frequency of![]()
The advantage of a heterodyne detector compared to the matched
filter detector is that the heterodyne detector compresses the signal in
frequency instead of time, and this feature enables the use of low bandwidth
digitizers and channel data acquisition, where digitizer bandwidth depends on
the maximum time delay or the range of the farthest multipath component. This
behavior is favorable for current SDRs that are limited in data acquisition
speed. However, matched filter detection gives the multipath structure in real
time as the output consists of the
time-compressed signal, whereas the heterodyne detector requires a post
processing spectrum analyzer to perform the same function. Therefore, applying fast
Fourier transform (FFT) over a single sweep gives a sin(x)/x main lobe centered at the
frequency corresponding to the time delay between transmitter chirp and replica
in the receiver.
In the post-processing step, applying the FFT algorithm gives a spectrum
that is extended in frequency from zero to half the sampling frequency ![]() , thus these samples can be scaled to the time delay domain using
sweep rate B/T according to
, thus these samples can be scaled to the time delay domain using
sweep rate B/T according to ![]() , where
, where ![]() �is the time delay of
the ith multipath component.
�is the time delay of
the ith multipath component.
III. Channel modeling and simulations
Our proposed scenario is characterization
of a moderately dense environment with several multipath components for AA
communication between two VLL UASs moving in random directions with relative
speed of ![]() �as depicted in Figure 5 (a). An example impulse
response of the channel is also plotted in Figure 5 (b), based on the objects present
in Figure 5 (a). Note that the number of multipath components could be different
in general.
�as depicted in Figure 5 (a). An example impulse
response of the channel is also plotted in Figure 5 (b), based on the objects present
in Figure 5 (a). Note that the number of multipath components could be different
in general.
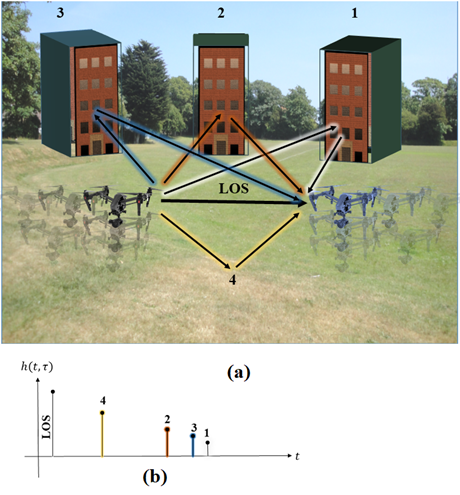
Figure 5. Example channel environment with example impulse response.
In this scenario, assuming two UAS
with relative speed of ![]() �maneuvering and communicating at frequency
�maneuvering and communicating at frequency ![]() �and based on (7) yields a Doppler bandwidth of
�and based on (7) yields a Doppler bandwidth of
![]() . Therefore in our channel
sounding we require a chirp with WRF value larger than
. Therefore in our channel
sounding we require a chirp with WRF value larger than ![]() �where
�where ![]() �is the maximum detectable Doppler frequency
shift.
�is the maximum detectable Doppler frequency
shift.
|
|
(7) |

In (7) ![]() �is the speed of electromagnetic wave
in the air, and q is the angle between
propagation and relative velocity vectors. As an example, for
�is the speed of electromagnetic wave
in the air, and q is the angle between
propagation and relative velocity vectors. As an example, for![]() �GHz and
�GHz and ![]() �=30 miles/hr (13.4 m/s) the maximum Doppler shift
is
�=30 miles/hr (13.4 m/s) the maximum Doppler shift
is ![]() �Hz. Thus, based on previous
criteria, the chirp signal WRF should be at least 216.1 Hz. However, to allow a
margin for additional shifts due to receiver oscillator frequency offsets, our Doppler
shift range is set to 250 Hz.
Considering a chirp signal with bandwidth
�Hz. Thus, based on previous
criteria, the chirp signal WRF should be at least 216.1 Hz. However, to allow a
margin for additional shifts due to receiver oscillator frequency offsets, our Doppler
shift range is set to 250 Hz.
Considering a chirp signal with bandwidth![]() �MHz, the minimum nominal time delay resolution
will be 40 ns, which corresponds to a 12 m minimum distance difference between
line-of-sight (LOS) and multipath components in order to be resolvable in our
channel sounder power delay profile (PDP). Considering all the criteria described
in the example channel scenario, we generated a chirp FMCW waveform with
parameters defined in Table 1.
�MHz, the minimum nominal time delay resolution
will be 40 ns, which corresponds to a 12 m minimum distance difference between
line-of-sight (LOS) and multipath components in order to be resolvable in our
channel sounder power delay profile (PDP). Considering all the criteria described
in the example channel scenario, we generated a chirp FMCW waveform with
parameters defined in Table 1.
Table 1. Proposed FMCW waveform parameters.
|
Parameter |
Value |
|
Center frequency |
2.42 GHz |
|
Bandwidth (B) |
25 MHz |
|
WRF (1/T) |
500 Hz |
|
Sampling rate |
50 MHz |
AA communication between two moving VLL entities
can be described as via a strong LOS path signal and signals that arrive at the
receiver by several different paths due to reflections from obstacles in the
environment. This channel can be simulated as a frequency selective fading Ricean
stochastic model in a pre-defined radio channel propagation scenario described
in Table 2.
Table 2. Proposed channel parameters.
|
Parameter |
Value |
|
Number of MPCs |
4 |
|
PDP delay vector |
[0, 30, 140, 290, 330] ns |
|
Normalized MPC magnitudes |
[1, 0.4, 0.1, 0.07, 0.04] |
|
Total relative speed |
30 miles/hr |
|
Channel fading model |
Ricean, K=8 dB |
|
Noise floor amplitude |
|
|
Maximum Doppler frequency |
108.1 Hz |
Our simulated
channel model is adapted from [12], where an improved sum-of-sinusoids (SOS)
based model was proposed for the accurate simulation of time-correlated and frequency
selective Ricean fading channels. Filter-based models are usually based on
passing a Gaussian process through a linear filter with a transfer function
equal to the square root of the Doppler power spectral density (PSD), but this method
can have higher computational complexity [13]. Both models are well established.
We add additive white Gaussian noise (AWGN) with noise floor relative amplitude
of -100 dB.


